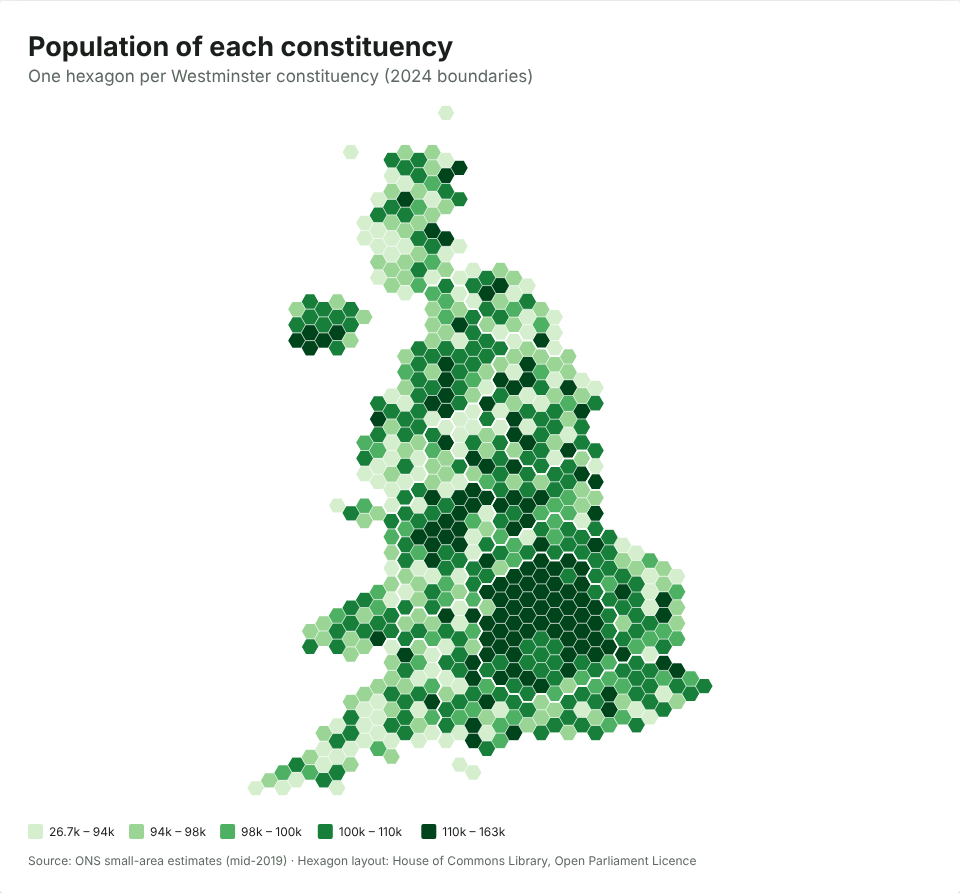
Westminster constituencies were drawn to have nearly equal numbers of voters, but the number of people living in them varies almost twofold. Leaving aside five protected island seats, the smallest constituency by population, Congleton, has about 84,000 residents; the largest, Cities of London and Westminster, has about 163,000. Thirty-one of the fifty most populous seats are in London.
The rule: equal electorates
For the 2023 boundary review, which set the seats used at the July 2024 general election, each constituency had to have between 69,724 and 77,062 registered electors, within 5% of a quota of 73,393, based on the electoral register of 2 March 2020. Five island seats were protected from the rule: the two Isle of Wight seats, Na h-Eileanan an Iar, Orkney and Shetland, and Ynys Môn (2023 review).
So every MP outside the islands represents roughly the same number of voters. They don’t represent the same number of people.
The numbers
Across the 645 seats subject to the rule:
| Population | |
|---|---|
| Smallest (Congleton) | 83,907 |
| 10th percentile | 92,181 |
| Median | 100,479 |
| 90th percentile | 117,075 |
| Largest (Cities of London and Westminster) | 162,641 |
The ten most populous seats are:
| Constituency | Population |
|---|---|
| Cities of London and Westminster | 162,641 |
| Birmingham Ladywood | 157,574 |
| Kensington and Bayswater | 147,231 |
| Hampstead and Highgate | 144,676 |
| Poplar and Limehouse | 141,599 |
| Erith and Thamesmead | 139,649 |
| Tottenham | 138,358 |
| Holborn and St Pancras | 137,909 |
| Bethnal Green and Stepney | 135,919 |
| Coventry South | 135,355 |
And by region, the average London seat has about 119,000 residents, against about 96,000 in Scotland and 97,000 in the South West.
Why the gap?
Equal electorates and unequal populations aren’t a contradiction: lots of residents aren’t on the electoral register. The seats with the most people per voter tend to share features that are likely to explain much of it:
- Children. Under-18s can’t vote in general elections, so seats with more young families have more residents per elector.
- People who can’t vote in general elections. Most foreign nationals, including most EU citizens, can’t, while Irish and qualifying Commonwealth citizens can. Seats with many residents from elsewhere have fewer electors per head.
- People who aren’t registered. Registration rates are lower among renters, people who move often and students, all common in inner cities.
- Timing. The populations here are mid-2019 estimates and the electorates come from March 2020; places growing fast have moved on since.
This data can’t separate these effects, so treat them as likely contributors rather than a measured breakdown.
What it means
Equal electorates are the legal standard, and there are good arguments for it: MPs are elected by voters. But MPs also serve residents who can’t vote, taking up their casework and representing them in Parliament. An MP for Birmingham Ladywood represents nearly twice as many people as one for Congleton.
How this map was made
The population figures are the ONS’s mid-2019 small-area estimates, added up for each 2024 constituency by mySociety, and they’re built into the JFDI map maker: it’s the UK constituencies example on the start page. The map uses the House of Commons Library’s hexagon layout, so every seat is the same size. On a normal map, London’s 75 seats would cover less than 1% of the picture; see why election maps use hexagons.
Open the example, change the colours, switch to real boundaries or add your own data, and download it. Every map you make is yours to use, with the boundary credit kept at the bottom.
Map of the month takes a public dataset each month and maps it. Suggestions are welcome.