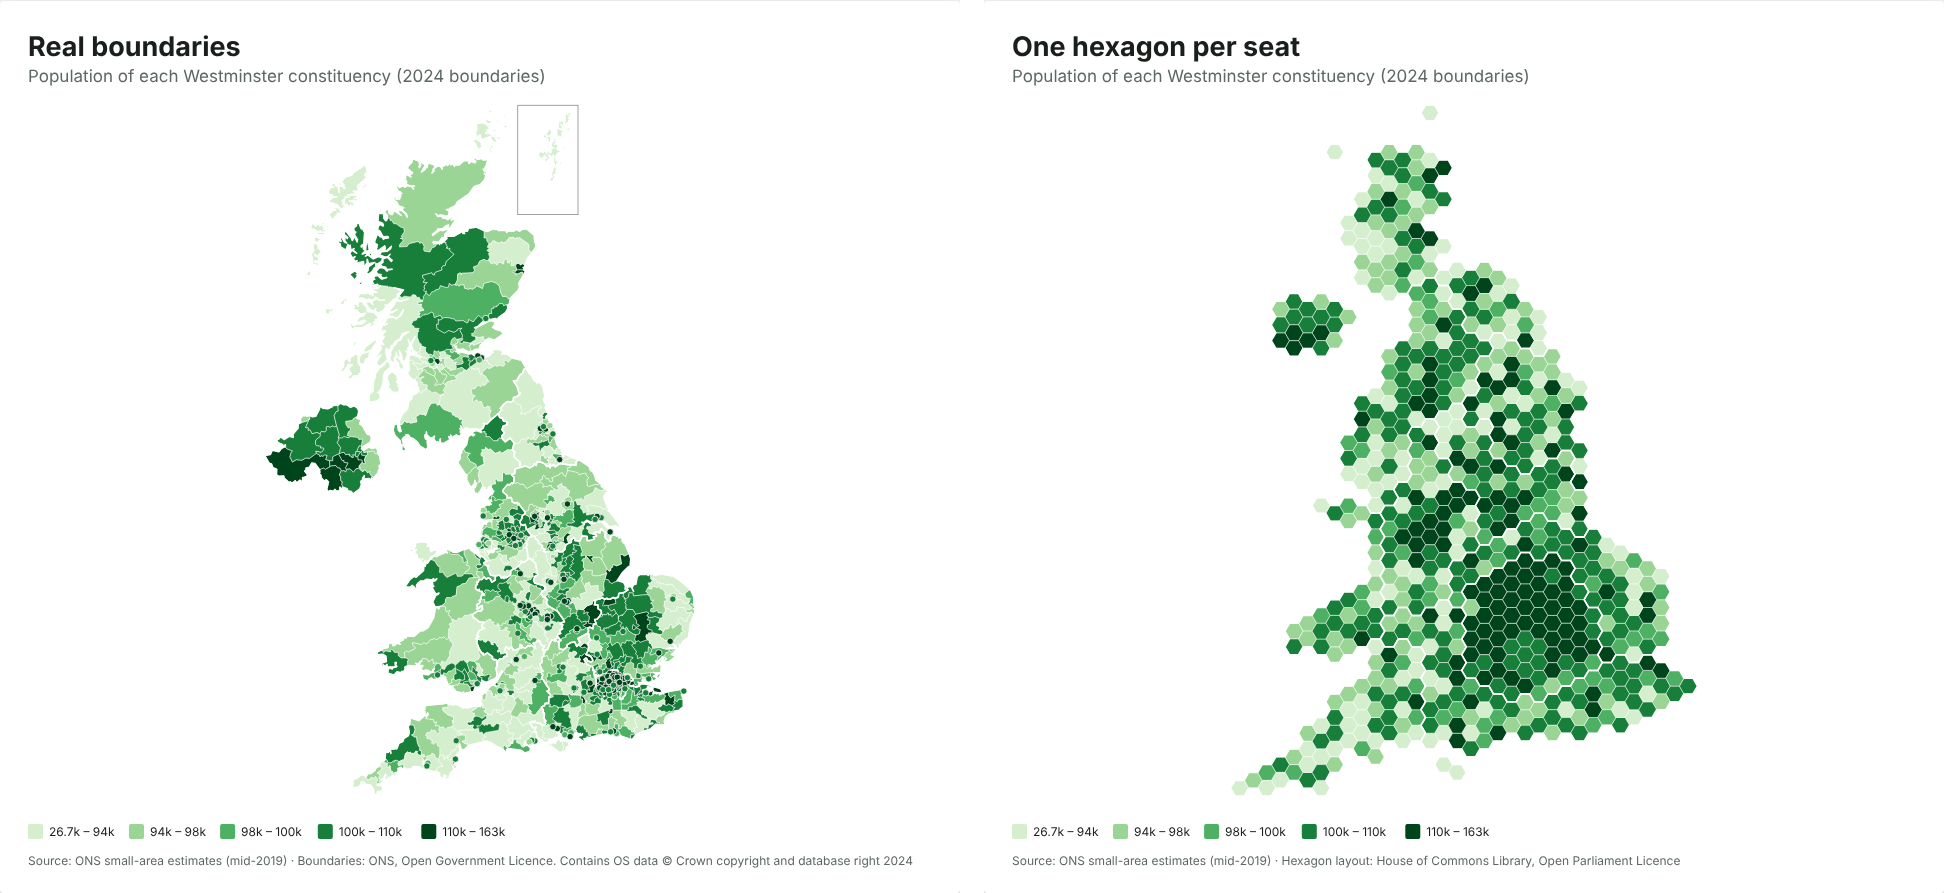
To make a map of UK parliamentary constituencies, you need a spreadsheet with one column of constituency names (or ONS codes such as E14001063) and one column of values. Paste it into the JFDI map maker and you get a map of all 650 Westminster seats, drawn on the July 2024 boundaries, without signing up or uploading anything.
This guide walks through it with real data, then covers the problems that trip most people up: old boundaries, spelling differences and party colours.
What you need
A table with two columns is enough (these values are made up):
| Constituency | Value |
|---|---|
| Aberafan Maesteg | 41.2 |
| Aberdeen North | 38.7 |
| Aberdeen South | 44.0 |
The first row should be a header. The values can be numbers (turnout, majority, population, a survey score) or words (the winning party, Leave or Remain). Words make a map of categories, each with its own colour.
You don’t need to tidy the names first. The map maker recognises constituencies by name however they’re written, and by their nine-character ONS code. If your file has both, that’s fine too.
Step by step
- Open the map maker and paste your cells into the box (copy them straight from Excel or Google Sheets), or drop a CSV or Excel file onto the page.
- Check the match count. The Data section says which map it chose and how many rows matched. For constituency data, it picks Constituencies as hexagons (2024) by default.
- Fix anything unmatched. Press Fix to see rows it couldn’t place. Typos come with a suggestion you can accept in one click.
- Choose colours and a title. Under Colours, pick a light-to-dark set for numbers, or keep the automatic colours for categories.
- Download it as PNG, SVG or PDF, or copy the embed code for a web page.
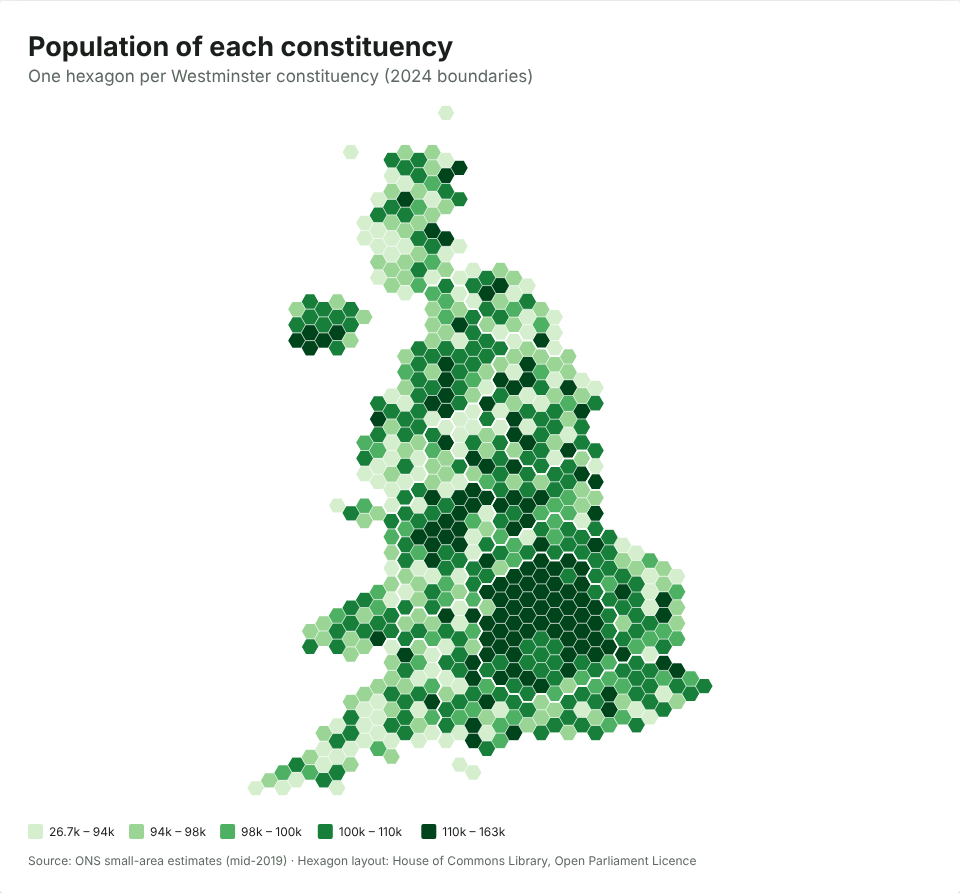
Hexagons or real shapes?
You get hexagons by default because they’re fairer for constituency data. Constituencies have roughly equal numbers of voters, but very unequal areas. Caithness, Sutherland and Easter Ross covers about 11,600 km², more than seven times the area of all 75 London seats put together (about 1,570 km²). On a normal map, the big rural seats dominate and you can barely see the cities.
On the hexagon map, which uses the House of Commons Library’s layout, every seat is the same size. Switch to real boundaries under Data › Map › Constituencies (2024) if you want geography instead. There’s more on this choice in Hex maps vs real maps: why election maps use hexagons.
Election results get party colours
If your values are party names (Labour, Conservative, Liberal Democrat, SNP, Plaid Cymru, Reform UK, Green and so on), the map uses each party’s usual colour, as election maps on TV do. You can switch to any other colour set under Colours.
Common problems
“Some of my constituencies don’t match”
The most common cause is old boundaries. Constituency boundaries changed at the July 2024 general election, and data from before then (including the 2019 results) uses the old seats. The map maker recognises the old ONS codes and tells you they’re from the previous boundaries, rather than quietly putting them in the wrong place.
Many names didn’t change in 2024, so a file can match almost perfectly and still be on old boundaries. Check the date of your data before you publish.
“It picked the wrong map”
If your table mixes levels (some councils, some constituencies), the map maker picks the level with the most matches. Choose the map yourself under Data › Map.
Totals and rates
If you’re mapping a count, such as the number of people claiming a benefit, compare like with like. Constituencies have similar electorates but not identical populations, so a rate (per 1,000 people, or a percentage) is usually fairer than a raw count. The map maker spots columns that look like totals and suggests a rate. Our explainer on what a choropleth map is and when it misleads goes into why.
Where the boundaries come from
The 2024 constituency boundaries are the Office for National Statistics’ generalised boundary files, published under the Open Government Licence, and the hexagon layout is the House of Commons Library’s, under the Open Parliament Licence. The map carries the required credit at the bottom; keep it if you crop the image. You can use the maps commercially.
Is my data private?
Yes. The map is drawn inside your browser, and the spreadsheet never leaves your device. That matters if you’re mapping unpublished polling, membership lists or canvassing returns. If you make a share link, the data travels inside the link itself, so treat the link like the data.