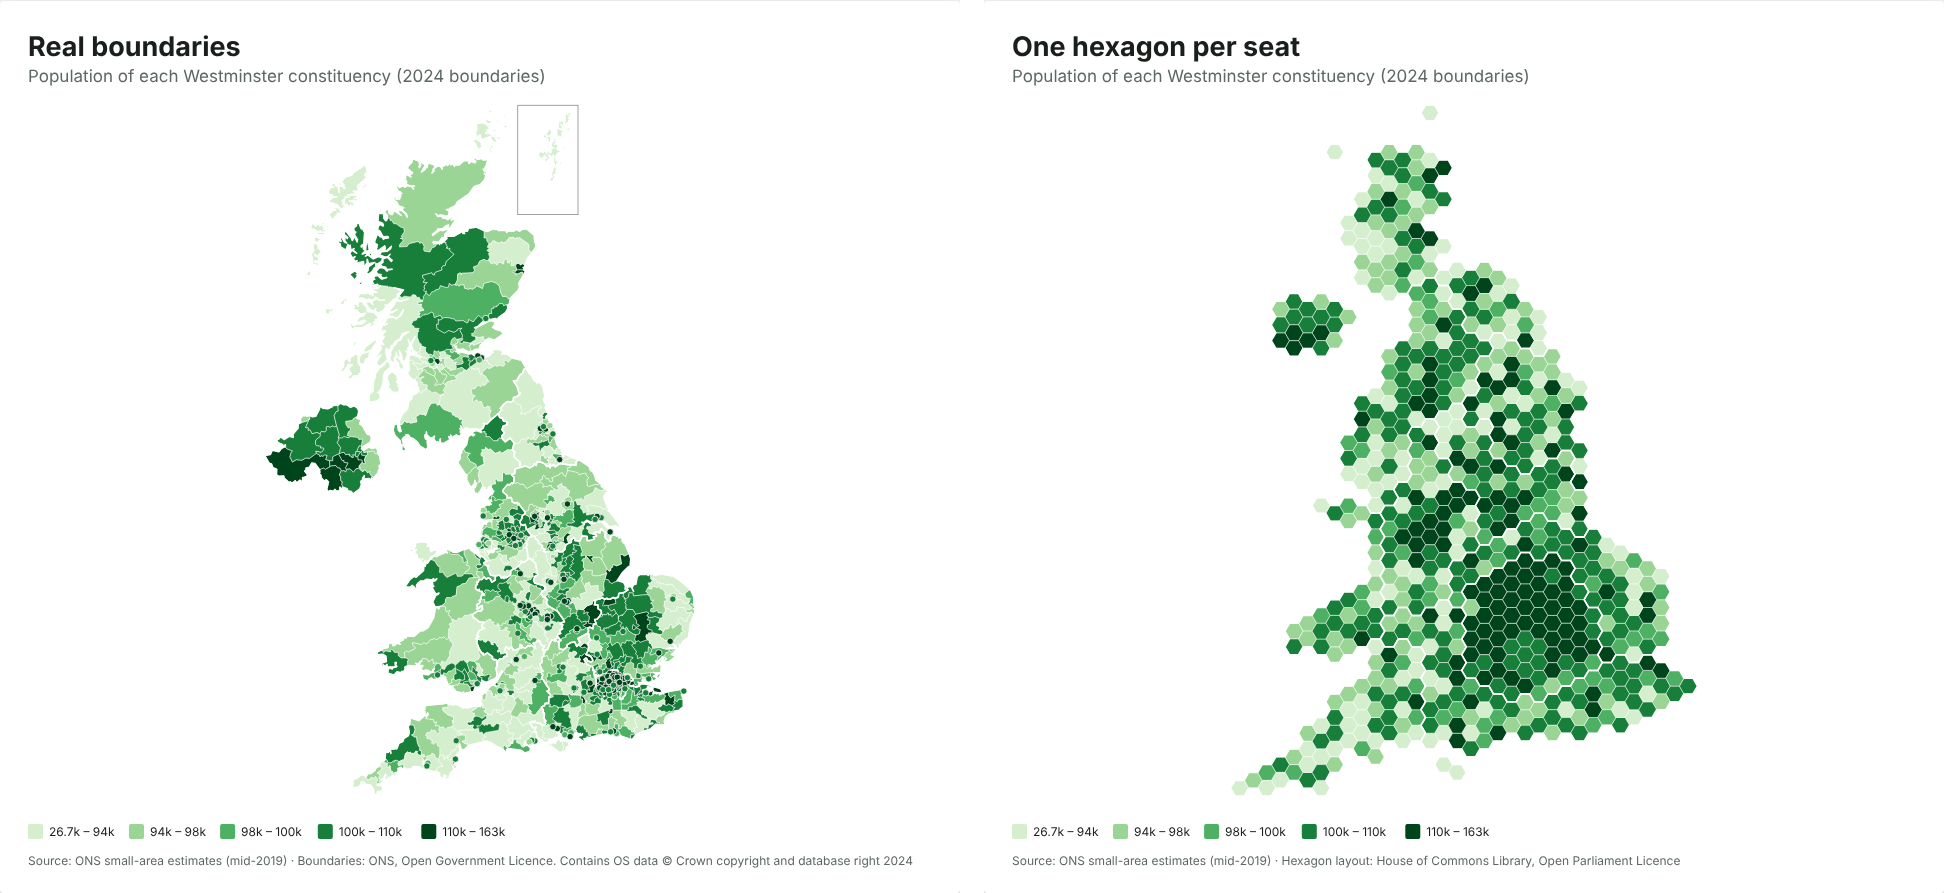
Election maps use hexagons because constituencies have roughly equal numbers of voters but wildly unequal areas. On a normal map, a handful of huge rural seats fill most of the picture and the cities shrink to specks. A hex map gives every seat one identical hexagon, so the picture shows seats, which is what decides an election.
The numbers behind the distortion
I added up the areas of all 650 Westminster constituencies on the July 2024 boundaries (ONS boundary files):
| Area | Seats | Share of seats | Share of UK land |
|---|---|---|---|
| London | 75 | 11.5% | 0.6% |
| Scotland | 57 | 8.8% | 32% |
| Rest of the UK | 518 | 79.7% | 67% |
London elects more MPs than Scotland, yet on a normal map Scotland takes up about fifty times as much space. Fifty-nine seats are smaller than 20 km², while the largest, Caithness, Sutherland and Easter Ross, covers about 11,600 km². Colour each seat by the winning party and the map mostly shows who won the Highlands.
What a hex map is
A hex map is a kind of cartogram: a map where the size of each area stands for something other than land. Here, each constituency is one hexagon, placed roughly where it really is so neighbours stay neighbours. London becomes a recognisable cluster, and you can see every seat in Manchester or Glasgow.
The layout used in the JFDI map maker is the House of Commons Library’s, the same one many newsrooms use. It’s published under the Open Parliament Licence.
When to use hexagons
Use a hex map when each area counts equally in what you’re showing:
- election results and vote shares
- polling or MRP estimates by seat
- anything per constituency that an MP or campaign will act on, such as casework or survey responses
Use real boundaries when geography matters:
- something physical, such as flood risk, broadband coverage or distance to a hospital
- when readers need to find a specific place by shape or coastline
- local data within one region, where size differences are smaller
The trade-offs
Hex maps aren’t free of distortion; they move it somewhere else.
- Shapes and positions are approximate. A seat may sit a hexagon away from where you expect. Labels or a hover tooltip help people find their own.
- Population isn’t exactly equal. Seats were drawn to have electorates within 5% of 73,393 (with five protected island seats excluded), but total population, including children and people not registered, varies much more.
- Readers need a moment. Add a subtitle such as “One hexagon per constituency” so nobody mistakes it for geography.
Councils: a different kind of cartogram
Local authorities vary in population as well as area, from the Isles of Scilly to Birmingham, so one hexagon each would be unfair the other way. For councils, the map maker offers Local authorities sized by population, also from the House of Commons Library, where each council is built from small hexagons of about 8,000 people. Big cities get room in proportion to their residents.
How to switch
In the map maker, load your constituency data, then open Data › Map and choose between Constituencies (2024) and Constituencies as hexagons (2024). Your colours, title and data carry over, so you can download both and compare them. The step-by-step guide covers getting your data in.
Sources
- Constituency areas: ONS Westminster Parliamentary Constituencies (July 2024) boundaries, Open Government Licence.
- Electoral quota: 2023 review of Westminster constituencies.
- Hexagon layout: House of Commons Library, Open Parliament Licence.